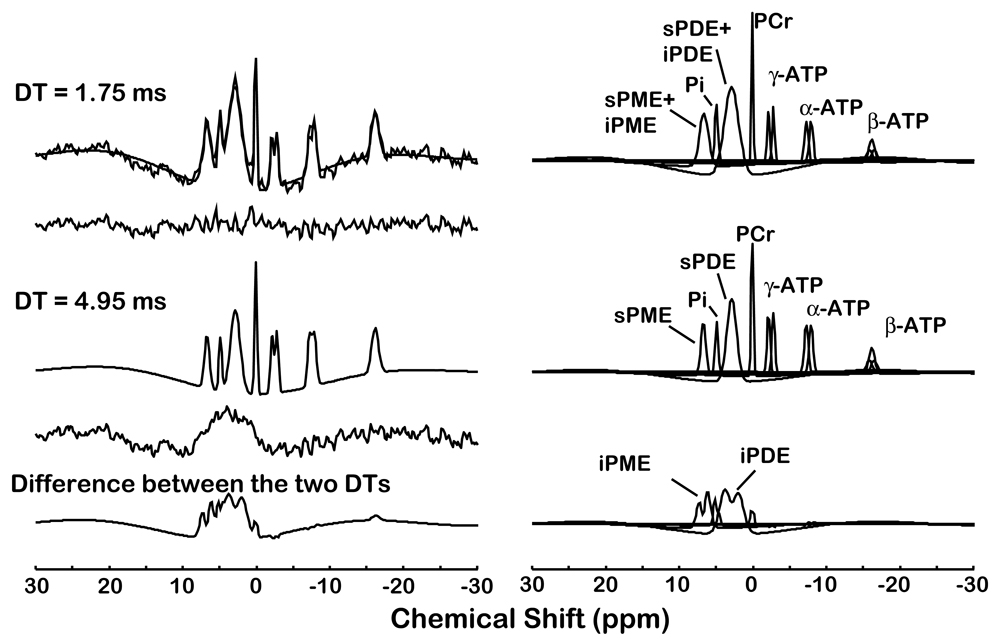
Figure 2.
Quantification of a typical in vivo 31P magnetic resonance spectroscopic imaging spectrum with 5 Hz line broadening from a single voxel (30×30×30 mm3 ) of a study subject. The acquired spectrum is modeled in the time domain with Gaussian-damped sinusoids and by omitting both the first 0.75 ms and first 2.75 ms of the free induction decay using the Marquardt-Levenberg algorithm. Both the short (0.75 ms) and long (2.75 ms) delay time (DT) models are shown superimposed on the acquired 31P spectra and the modeled resonances are identified on the right. The difference between the two time domain fits results in the bottom trace containing the intermediate correlation time components.

