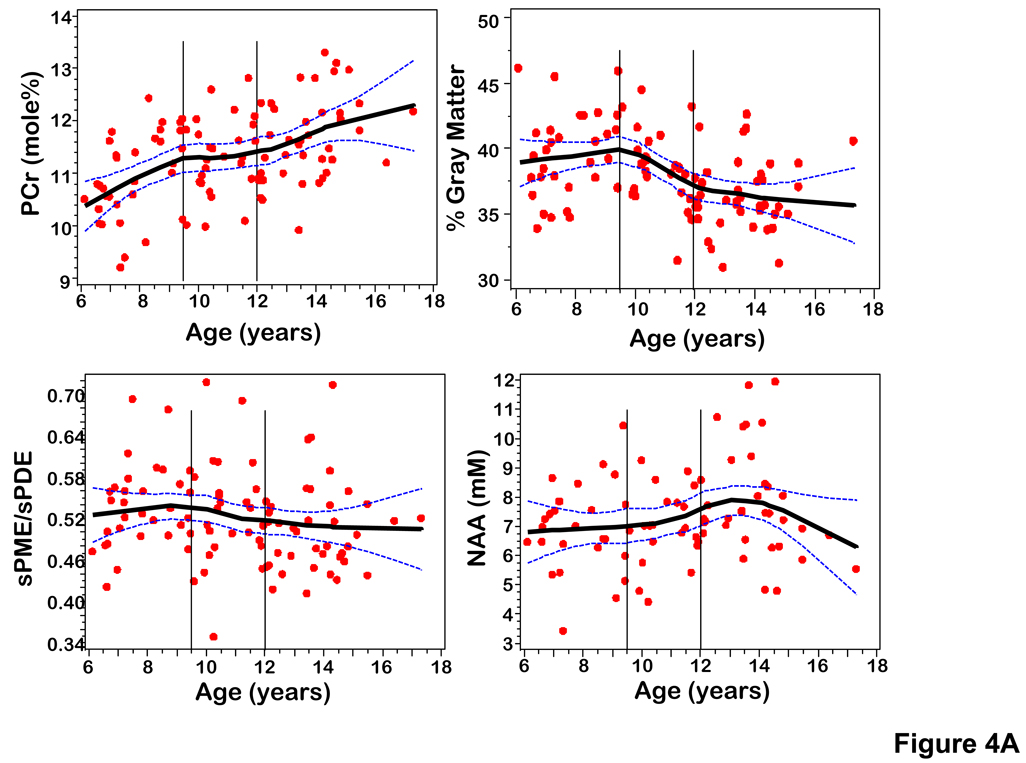
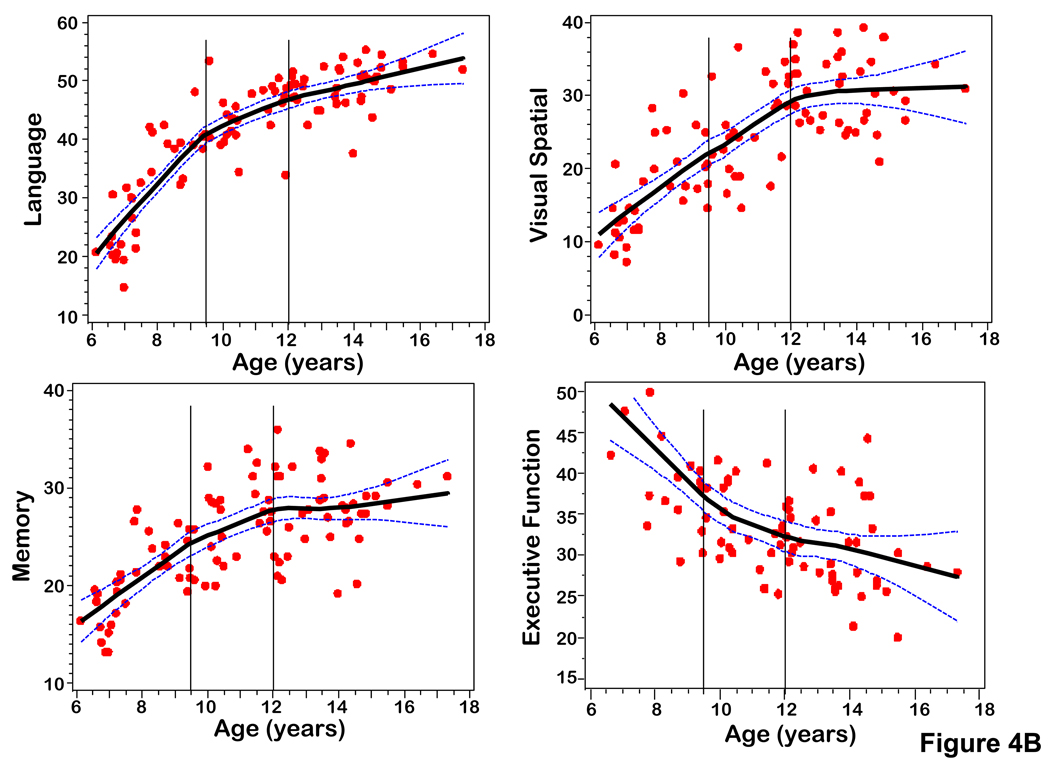
Figure 4.
(A) Scatterplots of PCr, sPME/sPDE, NAA, gray matter volume versus age fitted with a LOESS curve with 95% confidence intervals. (B) Scatterplots of composite scores for cognitive domains (Language, Memory, Visual Spatial, Executive Function) versus age fitted with a LOESS curve with 95% confidence intervals.


