
Figure 2.
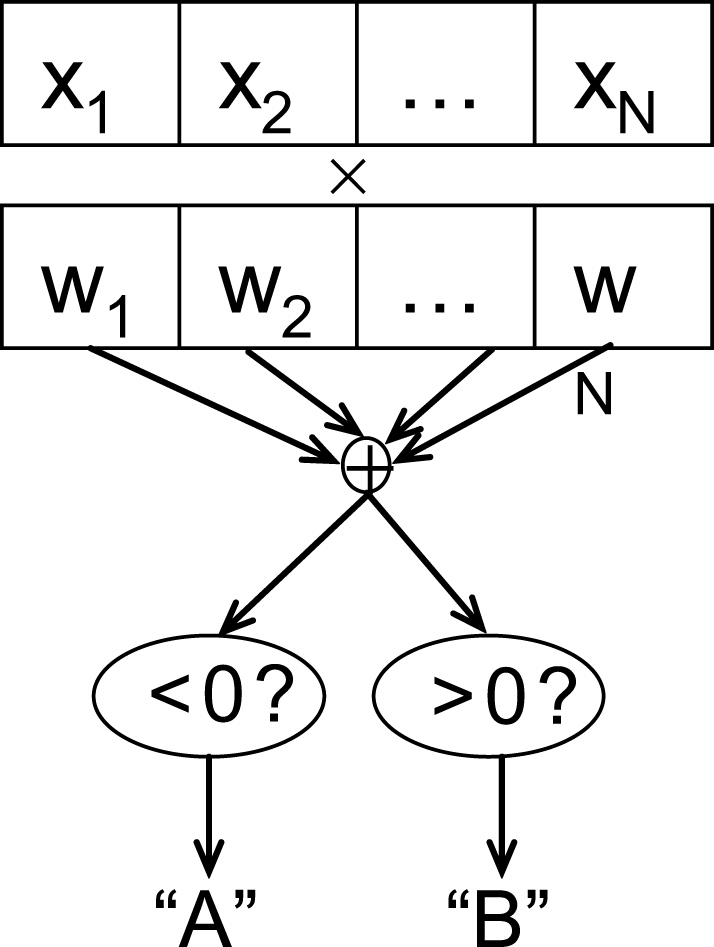
Schematic of linear classification. Each feature (xi) of the data point (x1,…,xN) is multiplied by its respective weight (wi), and the summation of the resulting terms () is evaluated. The classifier predicts that the data point is in “class A” if , and “class B” if .