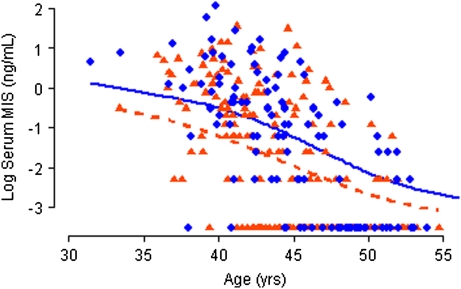
Figure 1.
Serum Müllerian inhibiting substance (MIS) by age in case patients and control subjects. Natural logarithm of serum MIS level plotted by age in case patients (blue circles) and control subjects (orange triangles) and smoothed lines fit with a kernel smoother for case patients (blue solid line) and control subjects (orange dashed line).

