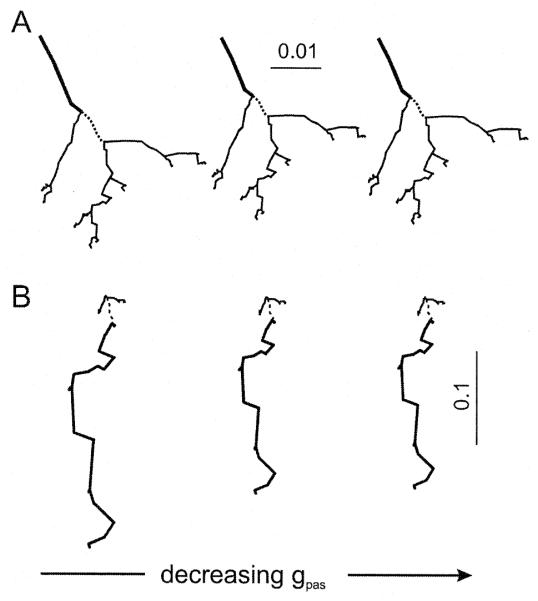
Fig. 4.
Influence of local changes in the membrane conductance, gpas, on attenograms from the model in Fig. 2. (A, B) Effects of changing the passive conductance of one segment of the dendritic tree (dashed line). Attenograms in A were generated with a current clamp at the IS; those in B with the clamp at the tip of a distal dendrite (as shown in Fig. 2B). The passive parameters for the equivalent cable were the same as in Fig. 2 for all dendrites except for the segment indicated by the dashed line: gpas (in Ω−1 cm−2)=10−3 for the left panels, 10−4 for the middle panels, and 10−5 for the right panels. Note the difference in scales in A and B. The segment in which electrotonic length was affected by the change in membrane conductance is represented by a thick line. Note that there is little difference between the middle and right panels because as gpas becomes smaller, the axial resistance (Ra=50 Ω cm) becomes the dominant factor in determining the electrotonic length of the dendrite.

