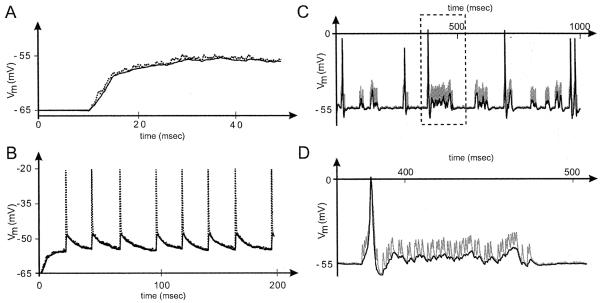
Fig. 5.
Effect of distal synaptic noise on the LN resting potential calculated at different points in a dendritic tree. (A) Random noise. Voltage plot showing the membrane potential recorded at the base of the main trunk (clamp C in Fig. 2B), and at a distal dendrite (clamp D in Fig. 2B). Noise (modeled by random synaptic input to all distal dendrites) is switched on at time t=10 ms, leading to a significant membrane depolarization to approximately −57 mV. In this and all subsequent records, the solid curve shows the response recorded at the base of the main trunk, while the dotted curve shows the response at the distal dendrite. Note that the random fluctuations in synaptic currents are much better preserved at the level of the dendrites. Ra=50 Ω cm, gpas>=10−4 Ω−1 cm−2, Eleak=epas=−65 mV. Ten randomly-firing and independent alpha synapses, with gmax=10−4 μS and τ=0.1 ms, were placed at random into each terminal branch of each dendrite. The firing interval for each synapse was determined using a Poisson distribution of mean equal to 5 ms. (B) Coordinated synaptic input. To model more accurately the effects of a natural olfactory stimulus, each of the distal dendrites in a glomerulus received bursting synaptic input from a spike generator that simulated input from odor receptor neurons. Note the attenuation and filtering of EPSPs recorded at the main trunk. The synchronized synapses linked to the spike generator used the parameters gmax=3×10⁻³ μS and τ=0.5 ms. (C) Addition of active currents. This model is similar to that in B, but the spike generator produces bursts which contain an average of 20 spikes (Poisson distribution) separated by 2 ms, and the gap between consecutive bursts is wider. Moreover, active Hodgkin–Huxley channels are inserted in the IS of the dendritic tree. In this configuration, bursts of EPSPs generated at the dendrites can summate and trigger action potentials in the IS. The default Hodgkin–Huxley parameter values used for this simulation are gK=0.036 Ω−1 cm−2, gNa=0.12 Ω−1 cm−2, gleak=3×10⁻⁴ Ω−1 cm−2, and eleak=−54 mV. (D) Detail of the outlined area in C.

