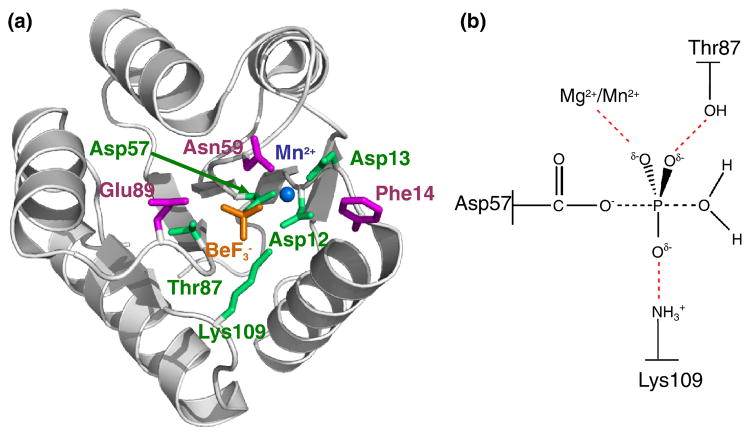
Fig. 1.
Overall structure of activated CheY and proposed transition state for autodephosphorylation. (a) Ribbon representation (gray) of wild type CheY•BeF3−•Mn2+ (pdb 1FQW) with active site features shown in color. Mn2+ is represented by a blue sphere. Conserved active site residues Asp57, Asp12, Asp13, Lys109, and Thr87 (green), BeF3− (orange), and variable active site residues altered in the study Phe14, Asn59, and Glu89 (magenta) are shown as stick models. (b) Schematic of proposed transition state in CheY autodephosphorylation reaction. Black dashed lines, partially formed covalent bonds; red dashed lines, stabilizing interactions between CheY and the phosphoryl group.

