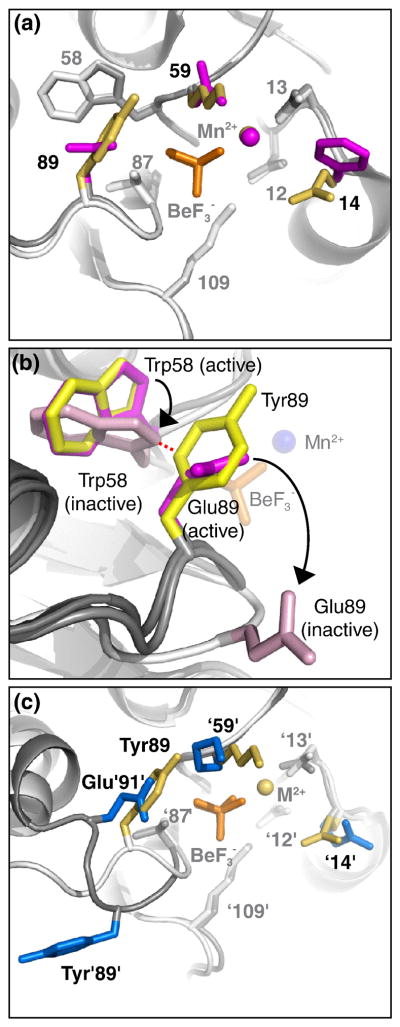
Fig. 4.
CheYSpo0F•BeF3−•Mn2+ does not display steric obstruction of the BeF3−. Panels a and c are from the perspective of a nucleophilic water molecule, looking straight down the line connecting the beryllium atom and Asp57 Oδ1 atom. The same general modeling scheme described in Fig. 2a, with only residues 14, 59, and 89 colored, applies to panels a and c. In panel b, the viewpoint is different and only residues 58 and 89 are colored. BeF3− is orange and Mn2+ is marked by a sphere in the color of the parent molecule. (a) Overlay of CheYSpo0F•BeF3−•Mn2+ (yellow side chains, white ribbon) and wild type CheY•BeF3−•Mn2+ (magenta side chains, gray ribbon). (b) Superimposition of CheY•BeF3−•Mn2+ (magenta side chains, gray ribbon, pdb 1FQW), apo-CheY (light pink side chains, white ribbon, pdb 3CHY), and CheYSpo0F•BeF3−•Mn2+ (yellow side chains, gray ribbon) reveals steric clash between CheYSpo0F Tyr89 and apo-CheY Trp58. CheY•BeF3−•Mn2+ is a model for the initial state of the autodephosphorylation reaction and apo-CheY is a model for the final state. BeF3− is orange sticks and Mn2+ is marked by a blue sphere. The distance marked by the red dashed line is <1.4 Å, indicative of a steric clash. Black arrows indicate movement of Trp58 and Glu89 from active to inactive conformation. (c) Overlay of CheYSpo0F•BeF3−•Mn2+ (yellow) and Spo0F•BeF3−•Mg2+ (blue, pdb 1FTK).

