
Figure 3. Dual inhibition of cytochrome c oxidase (complex IV) turnover (polarographic measurements) by CO + CN-, NO + CN-, and NO + CO.
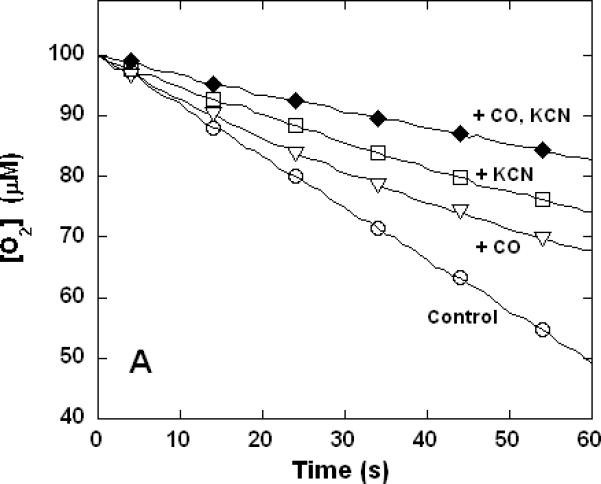
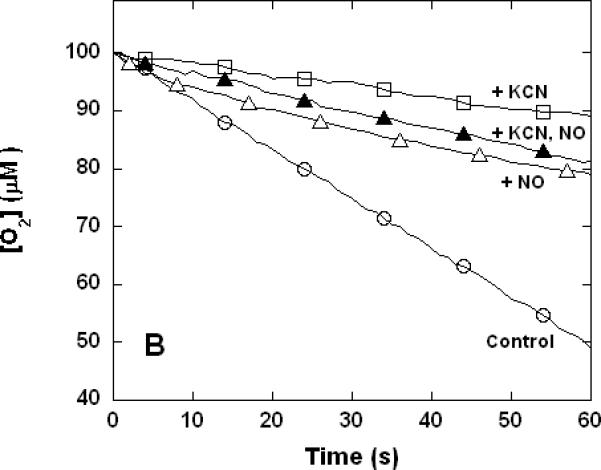
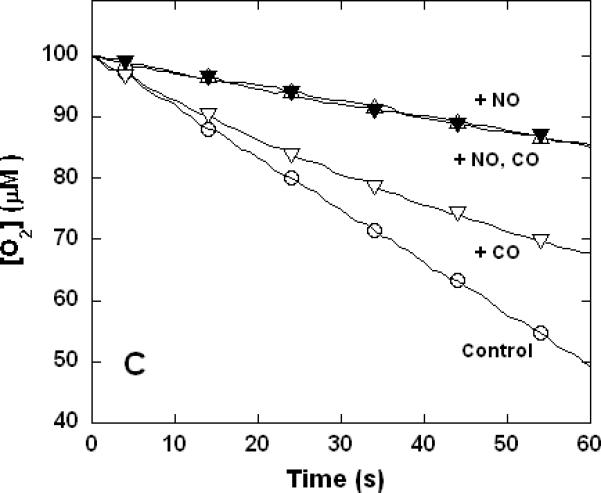
Clark-type oxygen electrode traces showing inhibition of O2 consumption, 500 nM enzyme, 60 μM ferrocytochrome c in 0.1 M aqueous potassium phosphate buffer, pH 7.4, 1.0 mM in EDTA, 0.05% in lauryl maltoside, 22 °C. Small adjustments to the locations of the traces relative to the ordinate axes have been made to assist with visual comparison. A. Uninhibited control (○), 1.0 mM CO (▽), 1.0 μM KCN (□), 1.0 mM in CO and 1.0 μM in KCN (◆); B. uninhibited (○), 8 μM NO (Δ), 2 μM KCN (□), 2 μM in KCN and 8 μM in NO (▲); C. uninhibited (○), 10 μM NO (Δ), 1.0 mM CO (▽), 10 μM in NO and 1.0 mM in CO (▼).