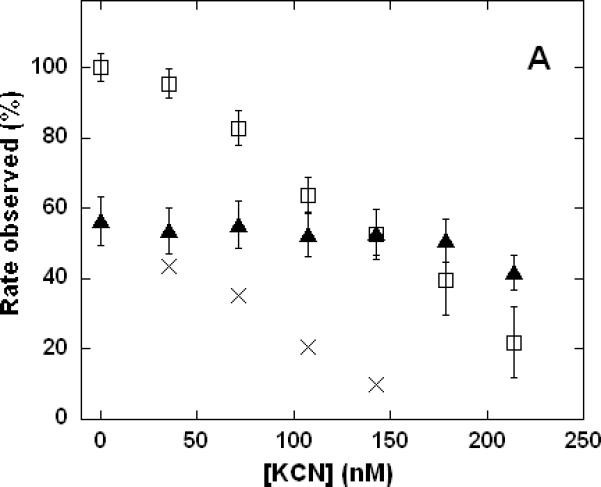
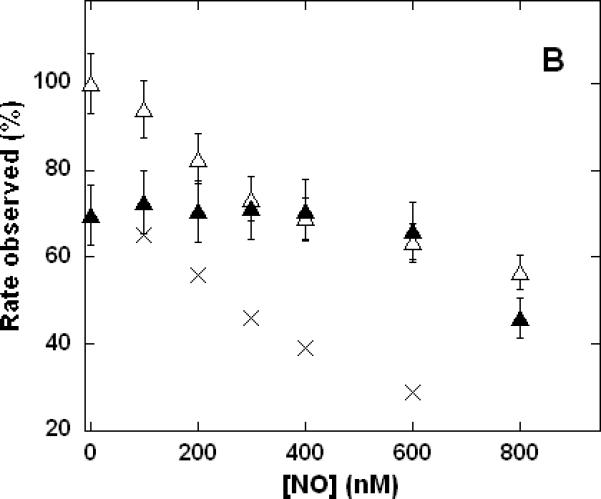
Figure 4. Dependence of cytochrome c oxidase turnover on the relative concentrations of NO and CN- during mixed inhibition.


Measurements performed in 0.1 M aqueous potassium phosphate buffer, pH 7.4, 1.0 mM in EDTA, 0.05% in lauryl maltoside, 22 °C, 2.4 nM enzyme concentration. A. Variable [KCN], without NO (□), NO added to 1.0 μM (▲); B. variable [NO], without KCN (Δ), KCN added to 80 nM (▲). Each point is the mean of 3-6 measurements, error bars represent standard deviations. Total inhibition predicted (assuming no interaction) by simple summation of the individual effects due to NO plus CN- (×).
