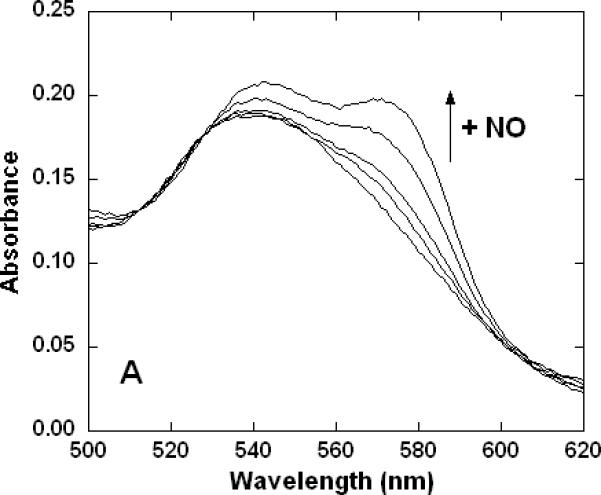
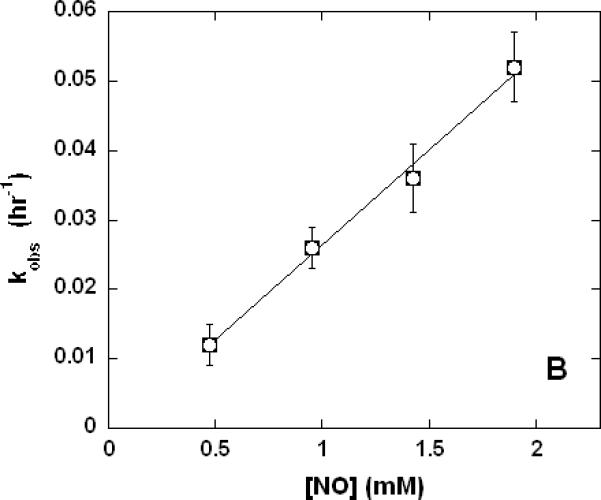
Figure 7. Reaction of NO with cyanomethemoglobin (metHbCN).


Samples were prepared in 100 mM aqueous potassium phosphate buffer, pH 7.4, 22°C, 1.00 cm pathlengths. A. Electronic absorption spectral changes (500-620 nm range) over time (~1 hr) of 14 μM metHbCN plus 0.95 mM (0.5 atm) NO. B. Linear dependence of the rate of reaction on the NO concentration.
