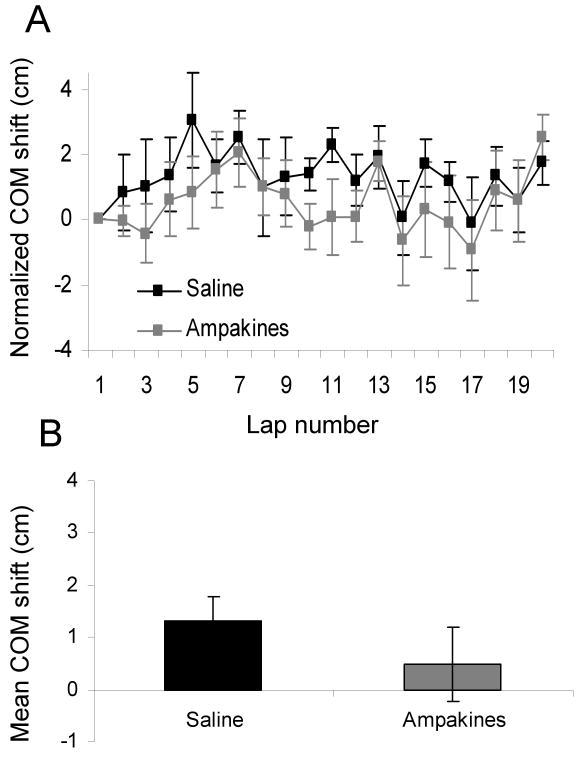
Figure 5.
(A) Shows the mean and SEM for normalized center of mass (COM) shift of place fields from laps one to twenty for the saline control (black), and 35 mg/kg of CX516 (grey). (B) The average normalized COM shift over all laps for the saline control (black) and CX516 (grey). The COM shift was similar between the two drug and the control conditions. Error bars indicate ± one SEM.

