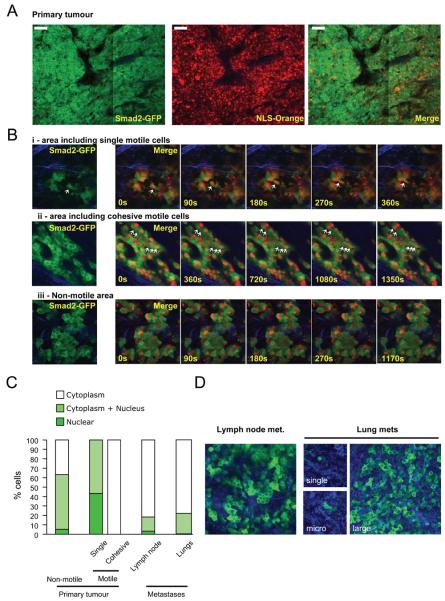
Figure 3. Nuclear accumulation of Smad2 in singly-moving cells.
A: Low magnification image of a primary MTLn3E tumour expressing GFP-Smad2 and NLS-Orange. B: Time series of higher magnification images of GFP-Smad2 and NLS-Orange expressing primary tumours are shown. i), ii) and iii) show areas including singly-moving (see also Movie 6), cohesively moving (see also Movie 7), and stationary cells (see also Movie 8), respectively. C: Quantification of Smad2 localisation in non-motile, singly-moving, and collectively moving cells in primary tumours, lymph node and lung metastases. 26 movies from 6 mice were analysed D: GFP-Smad2 localisation in a lymph node metastasis and different size lung metastases.

