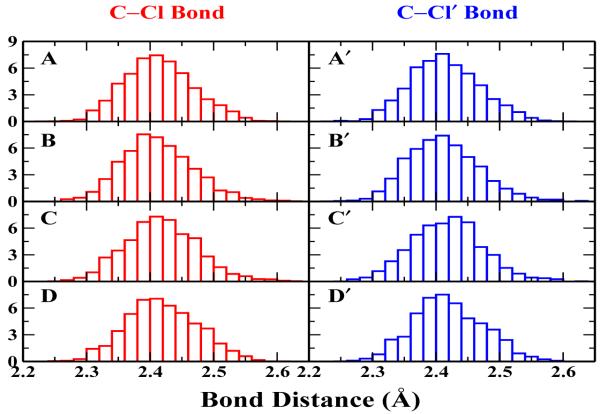
Figure 2.
The C-Cl and C-Cl’ bond distributions at the transition state for Cl− + CH3Cl → ClCH3 + Cl− reaction in water. Graph A, B, C, D indicate the C-Cl bond distributions for 0.5 fs and 1 fs with standard mass, 2 fs and 3 fs with modified hydrogen mass of 10 amu; Graph A’, B’, C’, D’ point to the C-Cl’ bond distributions for the same set of simulations respectively.

