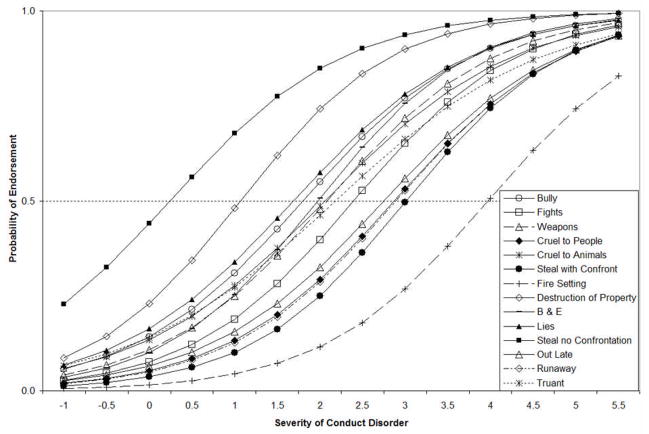
Figure 1.
Item Characteristic Curves for Conduct Disorder items
Figure 1 shows the item characteristic curves (ICCs) for each of the CD symptoms. On the x-axis, the severity of CD is scaled to have a mean of 0 and a standard deviation of 1 in males. The severity parameter for an item can be determined by identifying the point on the x-axis where the probability of endorsement (y-axis) is 50% (indicated by a dashed line). For example, the severity parameter for “Steal no Confrontation” is 0.24. The ICCs also depict the discrimination parameters of items; ICCs with steeper slopes have higher discrimination parameters.

