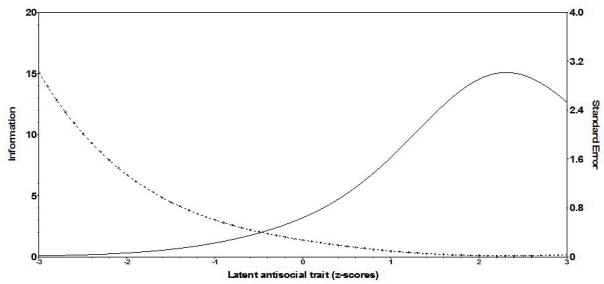
Figure 3.
Test information curve for DSM-IV Conduct Disorder
Figure 3 shows the test information curve (TIC) which displays how all Conduct Disorder criteria function together to provide information across the range of severity of the latent antisocial trait. X-axis = the latent antisocial trait expressed as z-scores. Solid line; left axis = total information aggregated across all Conduct Disorder criteria for each level of severity of the latent antisocial trait. Dotted line; right axis = standard error of estimation for each level of severity of the latent antisocial trait.

