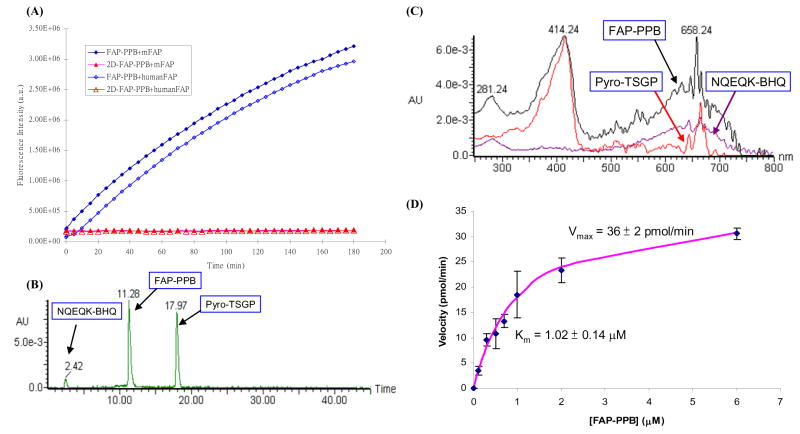
Figure 2.
(A) Changes in fluorescence intensity of FAP-PPB and 2D-FAP-PPB upon interactions with human FAP and mFAP (50:1 molar ratio) in a TRIS buffer solution at 37 °C. (B) HPLC profile of FAP-PPB after 1-hour incubation with mFAP. (C) UV-Vis spectra for the corresponding portions. (D) Variation of the initial cleavage rate of FAP-PPB by mFAP (2 μg) (as shown by the increase in fluorescence intensity at 665 nm) with increasing concentration of FAP-PPB. The estimated Km and Vmax values are indicated and the error bars represent standard deviations from the mean from triplicate measurements.

