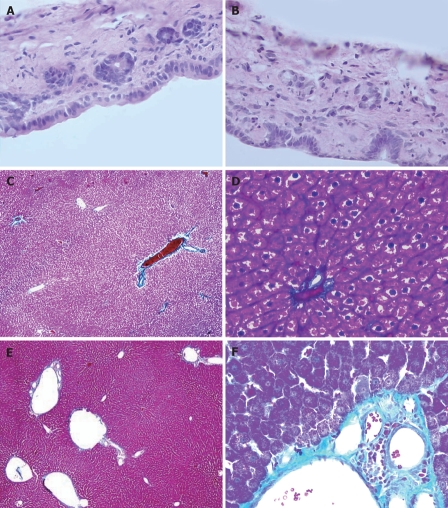
Figure 7.
The pathological changes of hepatohilar bile duct and the liver in rats 6 mo after PVA using HE staining and Masson staining. A: Hepatohilar bile ducts in control group (HE, × 400); B: Hepatohilar bile ducts in PVA group (HE, × 400). C: Masson staining of the liver 6 mo after operation in control group (× 40); D: Masson staining of the liver 6 mo after operation in control group (× 400). E: Masson staining of the liver 6 mo after PVA in PVA group (× 40); F: Masson staining of the liver 6 mo after PVA in PVA group (× 400).

