
Fig. 1.
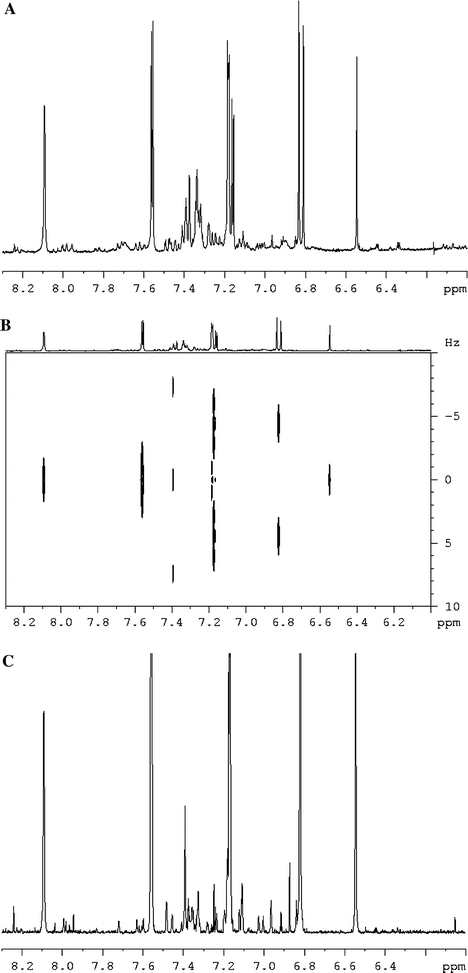
1H NMR (a), two dimensional J-resolved (b), and projected one dimensional J-resolved (c) spectra of control Catharanthus roseus cell line in the range of δ 6.00–δ 8.00
Official websites use .gov
A
.gov website belongs to an official
government organization in the United States.
Secure .gov websites use HTTPS
A lock (
) or https:// means you've safely
connected to the .gov website. Share sensitive
information only on official, secure websites.
1H NMR (a), two dimensional J-resolved (b), and projected one dimensional J-resolved (c) spectra of control Catharanthus roseus cell line in the range of δ 6.00–δ 8.00