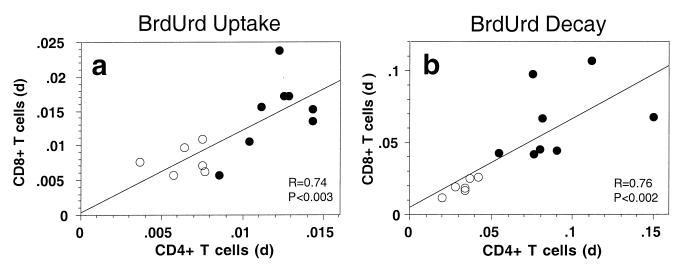
Figure 3.
Correlation of BrdUrd labeling and decay rates of CD4+ and CD8+ T cells. (a) Correlation of the labeling coefficients for uptake of BrdUrd by CD4+ and CD8+ T lymphocytes during administration of BrdUrd to normal and SIV-infected animals. Labeling coefficients were calculated by linear regression analysis. (b) Correlation of the elimination rates for BrdUrd-labeled CD4+ and CD8+ T lymphocytes after stopping administration of BrdUrd to normal and SIV-infected animals. The elimination rate of BrdUrd-labeled CD4+ and CD8+ T lymphocytes was calculated by nonlinear regression analysis. Each symbol represents an individual animal; open circles are normal animals, and closed circles are SIV-infected animals. R and P values for linear regressions for both uptake and decay rates are shown.

