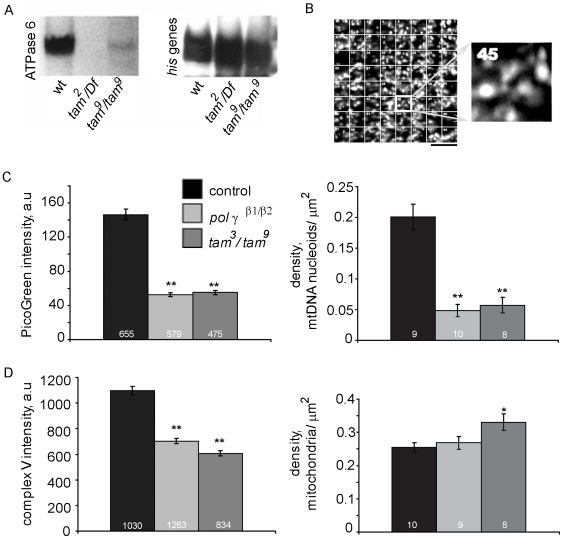
Figure 2. Mitochondrial density is higher in tam3/tam 9 mutants whereas density of mtDNA nucleoids is reduced.
(A) Southern blot analysis of total DNA extract, hybridized with 32P-labeled DNA probes from the ATPase 6 gene of mtDNA shows a decrease in pol γ mutants compared to wildtype controls. A histone gene cluster (his genes) is used as a nuclear DNA control. (B) Density of mitochondria and mtDNA nucleoids is measured by dividing a 512×512 pixel frame of the muscle into a grid of 64 regions of interest (ROIs). A random list of numbers (1–64) was generated and the number of mitochondria/mtDNA nucleoids was counted in those ROIs for each frame. (C) Intensity of PicoGreen stained mtDNA (in arbitrary units, a.u); as well as density of mtDNA nucleoids was reduced significantly in pol γ mutant muscles. Numbers at the base of columns represent number of mtDNA nucleoids sampled and number of animals used, respectively. (D) Intensity of complex V stained mitochondria is reduced significantly in both pol γ mutants (in arbitrary units, a.u); while average mitochondrial density is increased moderately in tam 3/tam 9 mutant muscles. Numbers at the base of columns represent number of mitochondria sampled and number of animals used, respectively. Error bars represent 95% confidence intervals. * indicates p<0.05 and ** indicates p<0.001 from Student's t-test.

