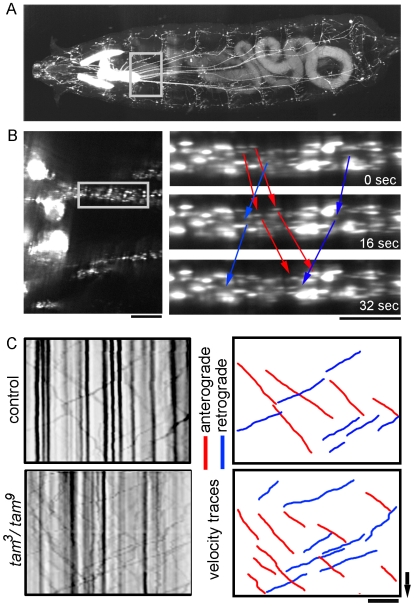
Figure 7. Measurement of flux and velocity of axonal transport from Drosophila segmental nerves.
(A) 3-D reconstruction of a 3rd instar Drosophila larva expressing UAS-mtGFP in segmental nerves under the D42-GAL4 driver. Mitochondria can be visualized in the CNS, salivary glands and the entire length of segmental nerves. There is some auto-fluorescence in the gut. A single optical plane from the proximal region of the two medial nerves was used for time lapse imaging as described in the methods section. (B) Kymographs were generated as described in the methods section. Dark vertical lines denote docked mitochondria; hand traced red lines depict mitochondria moving in the anterograde direction while blue lines depict retrograde movement. The slope of these lines yields velocity of transport. Arrow represents 20 s and the scale bar equals 10 µm.

