
Figure 1.
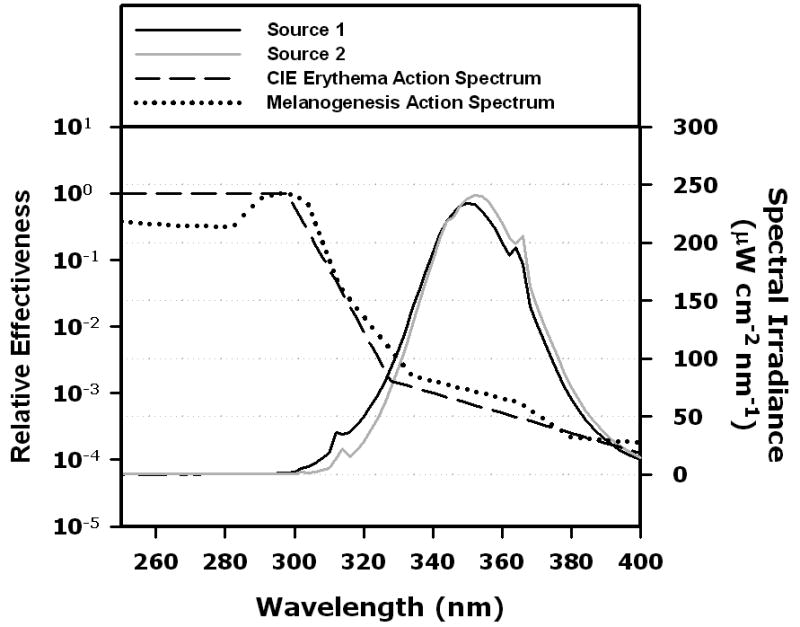
Emission spectra of the UV sources used in this study (canopies fitted with 12 sunlamps). Black line: source 1, grey line: source 2. For comparisons, action spectra are included: dashed line indicates CIE Erythema Action Spectrum 16, dotted line indicates melanogenesis action spectrum 2. The ordinate on the right side: spectral irradiance. The ordinate on the left: relative effectiveness at each wavelength for inducing erythema or melanogenesis.