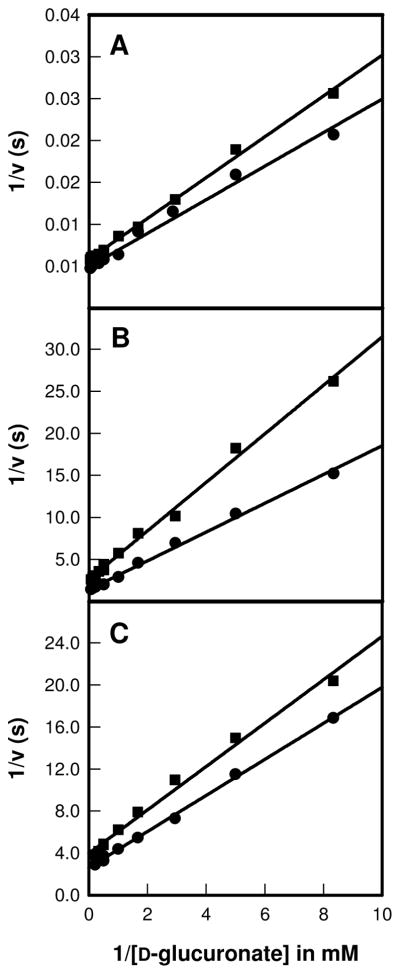
Figure 2.
Double-reciprocal plots for the solvent isotope effect (H2O vs D2O) where 1/v (s) is plotted against 1/[D-glucuronate] (mM−1). The data sets in H2O are represented by circles and the squares correspond to the values obtained in D2O. (A) represents the plot for the wild type enzyme, (B) for the R414M mutant, and (C) is the plot for the D412N mutant.

