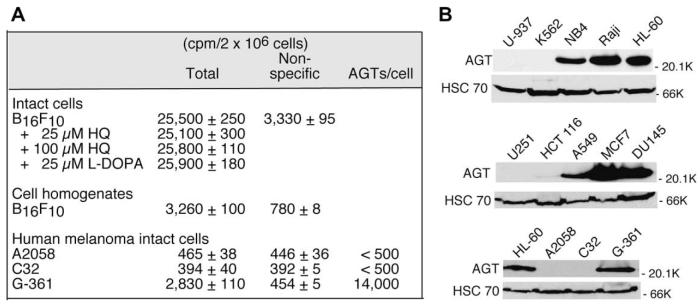
Fig. 7.
AGT assays conducted for various melanoma cell lines and the correlation between AGT levels measured by the AGT assay and Western blot analysis. (A) Standard AGT assays were performed for various human melanoma cell lines and for intact B16F10 cells in the presence of HQ or L-DOPA. HQ was dissolved in Me2SO at a concentration of 20 mM. L-DOPA was dissolved in 0.001 N HCl at a concentration of 5 mM. (B) Whole cell extracts were prepared from various human cell lines and subjected to Western blot analysis for AGT using HSC 70 as a loading control. K, thousands (000) (far right of panel B).

