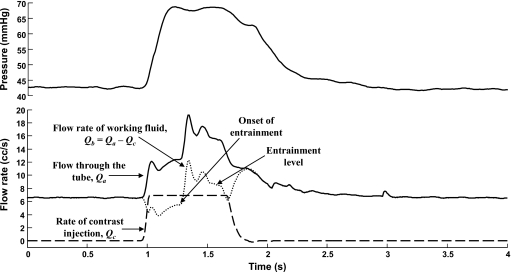
Figure 3.
Hemodynamic variables in the flow loop during the injection of contrast for one of the experimental cases (Exp I #3). The tube flow rate measured by the flow probe (Qa) is shown as a solid line whereas the injection profile (Qc) is shown as a dashed line. Flow rate of the working fluid only (Qb, dotted line) is obtained by subtracting the injection profile from the tube flow rate. About 0.4 s into the injection, entrainment begins with a large starting transient (onset of entrainment) and eventually stabilizes at a value higher than the preinjection flow rate (entrainment level). After the injection is stopped, the pressure and the flow through the tube decay to preinjection levels.

