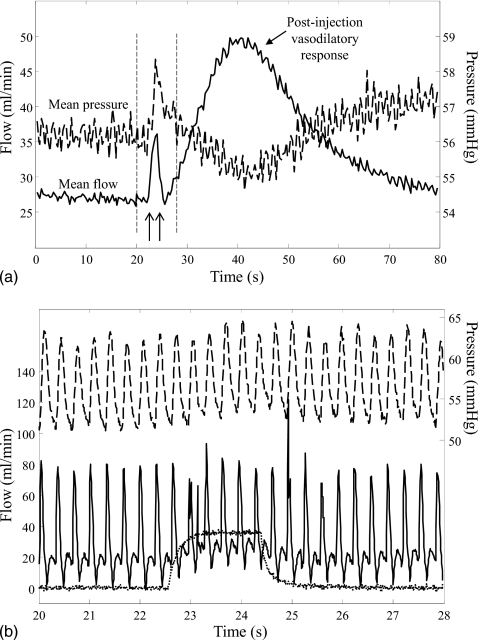
Figure 5.
Recorded flow and pressure traces for one case from experiment II, rabbit 2; nominal contrast injection rate of 0.6 cc∕s. Panel (A) shows the cardiac average flow (solid line) and cardiac average pressure (dashed line) over a 80 s acquisition period; arrows indicate start and stop of contrast injection. A vasodilatory response followed most injections. Vertical dashed lines indicate the time window showing in panel (B). Panel (B) shows the pulsatile flow (solid line) and pulsatile pressure (dashed line) recorded during contrast injection (dotted line).

