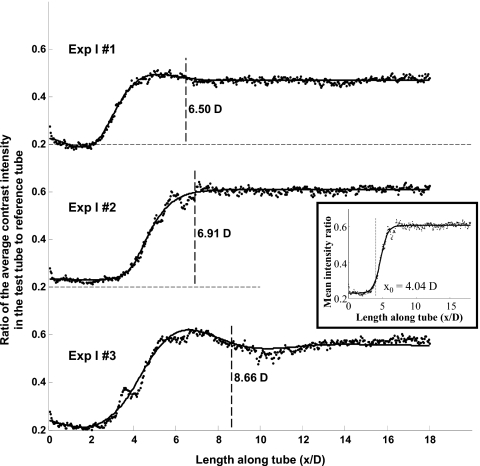
Figure 7.
Second-order step response fits (solid lines) to the ratio of the cross-sectional average contrast concentration along the length of the flow tube to reference tube (dotted lines) for the three experimental cases at 0.633 s from start of injection. Mixing length for each case is indicated (dashed lines) as the distance after which the step response settles to within 3% of the steady state value. Inset shows the fit of a sigmoid function to the experimental data for one case (Exp I #2) to identify the jet intact core penetration length (x0). D is the tube diameter.

