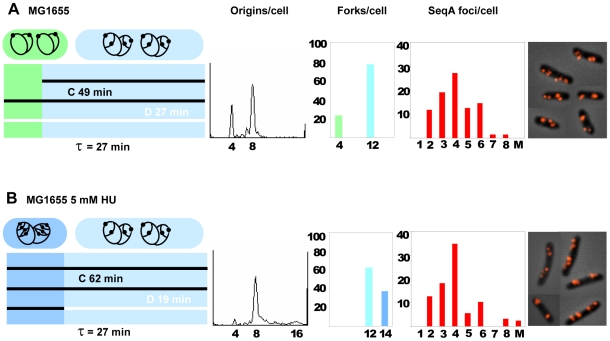
Figure 2. Replication patterns, fork- and SeqA focus distributions in cells grown w/ or w/o HU.
MG1655 wild type cells were grown in the absence (A) or presence (B) of 5 mM HU (cells from panel 1 and 3 in Figure 1A). First panel: schematic diagram of the cell cycle where the length of the diagram corresponds to the generation time (τ). It also represents the cell age where newborn cells are found to the left and the oldest cells that are about to divide are found to the right. The time periods before and after the different cell cycle events (initiation and termination) are in different colors. On top of the diagram cells with corresponding replication patterns are drawn. A black circle and black dot represent the chromosome and the origin, respectively. Each horizontal bar represents one generation and is colored black for C and white for D as one replication cycle is followed through three generations. The duration of C was found from the oriC/terC ratio obtained by Southern blot analysis and quantitative PCR. The initiation time point and C+D period were determined from the run-out histogram and the generation time, and D was determined by subtraction of C from C+D (Figure S1 and Materials and Methods). In A the age of initiation was found to be at about 5 minutes since 23% of the cells contained 4 origins (green). Cells older than 5 minutes contained 8 origins and 12 forks (light blue). Cells grown in the presence of 5 mM HU initiated replication at 4 origins when newborn and thus all cells contained 8 origins (Figure 2B, left panel). When young, these cells contain 14 replication forks (blue), and after termination of the two “oldest” forks the cells contained 12 forks (light blue). Second panel: DNA histograms of rifampicin- and cephalexin treated cells. Third panel: the distributions of replication forks in exponentially growing cells where the percentages of cells are plotted against the numbers of replication forks per cell. The different colors correspond to the different stages of the cell cycle as used in the diagram in the first panel. Fourth panel: SeqA focus distributions in exponentially growing cells where the percentages of cells are plotted against the numbers of SeqA foci per cell. A: 136 cells counted, the foci number of 11.8% of the cells was not determined. B: 127 cells counted, the foci number of 13.4% of the cells was not determined. Fifth panel: micrographs of fixed cells immunostained with antibody against SeqA.

