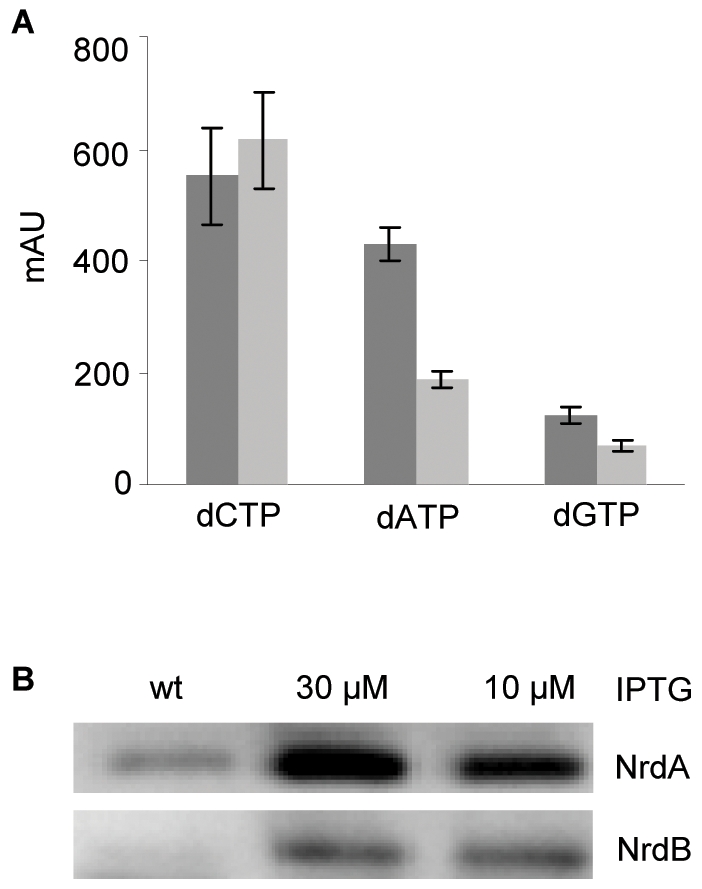
Figure 4. Reduced concentrations of dNTPs in cells where mutant RNR is expressed from an inducible promoter.

A: Nucleotides were extracted from wild type cells and SMG386 cells grown in the presence of 10 µM IPTG and analyzed by HPLC. The value of each dNTP is given as an arbitrary unit corresponding to the area under the curve. Each bar represents the average of three independent experiments and the standard error of the mean (SEM) is shown. The level of dTTP was measured after an additional purification step using boronate affinity chromatography as explained in Materials and Methods. B: Western blot with antibodies against NrdA or NrdB proteins. Lane 1: 10 µg cell extract of SMG367 cells (wt), lane 2 and 3: 10 µg cell extracts of SMG386 cells grown in the presence of 30 or 10 µM IPTG, respectively.
