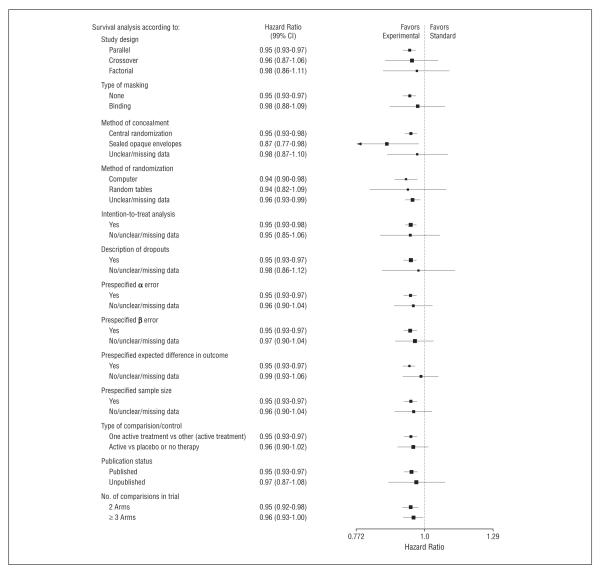
Figure 5.
Sensitivity analysis according to the most important methodologic domains. Vertical lines indicate lines of no difference between new and standard treatments. Note that a “no difference” result can be obtained when treatments are truly identical, or when experimental treatments are as successful as standard treatments (ie, sometimes new treatments are better and sometimes standard treatments are better). Squares indicate point estimates. Horizontal lines represent 99% confidence interval (CI).

