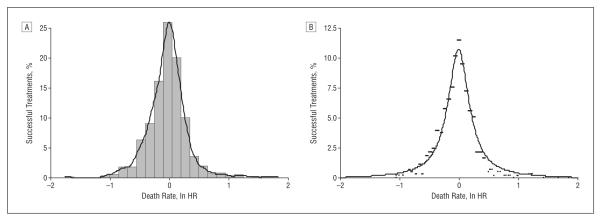
Figure 8.
Distribution of treatment success in oncology. A, Although the data resemble normal distribution, the curve significantly deviates from normality (Shapiro-Wilks test: z=7.97; P<.001). B, The best fit was accomplished by using a power law function, y=A/[1+(B×x2)], where y represents the percentage of treatment success with experimental or standard treatment, and x is expressed as natural logarithm of the hazard ratio (ln HR). If ln HR is less than 0, then y predicts success of experimental treatments and vice versa. A=10.76; B=21.87; r2=95%.

