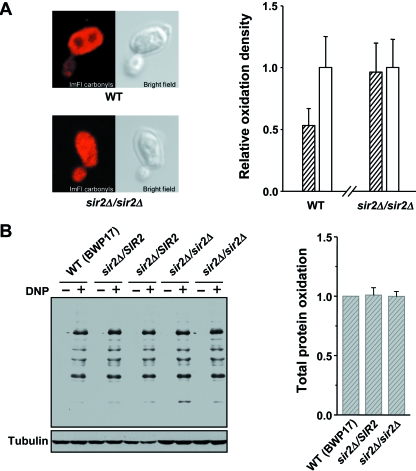
Fig. 6.
Analysis of oxidatively damaged proteins in wild-type and sir2Δ mutant cells. (A) Immunofluorescent detection of the distribution of oxidatively damaged proteins in mother and daughter cells. Left panel, typical budding cells visualized by Confocol microscopy. Right panel, oxidation density was quantified and compared between mother (open bars) and daughter (filled bars) cells. Fifty mother cells and corresponding daughter cells of each strain were used for quantification. Error bars are the standard deviations. Average oxidation density of daughter cells as compared with their mothers (assigned as 1): WT (0.53), sir2Δ/sir2Δ (0.96). (B) Western blot analysis of the overall protein oxidation in wild-type, sir2Δ/SIR2 and sir2Δ/sir2Δ cells. Tubulin is used as an internal control. Right panel shows the quantification results. The level of total protein oxidation in wild-type strain was assigned as 1. Error bars represent standard deviations of two independent clones.

