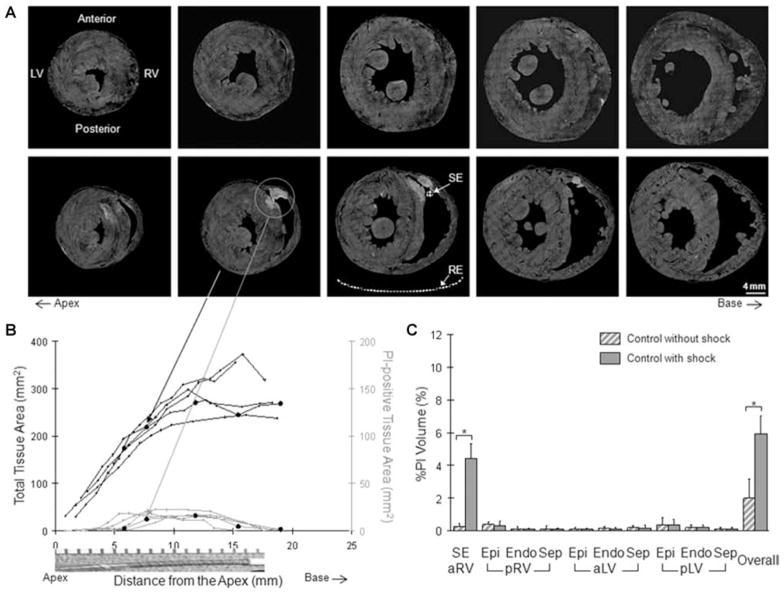
Figure 3.
Fluorescence study of the control group. (A) Series of transverse sections from the control hearts without shock (top row) and with shock (bottom row). The shock electrode (SE) and reference electrode (RE) positions are representatively illustrated. (B) Electroporation was quantified in the shock electrode region along the long axis of the heart. The circle markers represent measurements from the transverse sections shown in the bottom row of A. A picture of the shock electrode is shown for spatial correspondence. (C) The regional and overall extent of electroporation in the control group with and without shock was integrated along the long axis of the heart. *P < 0.05.

