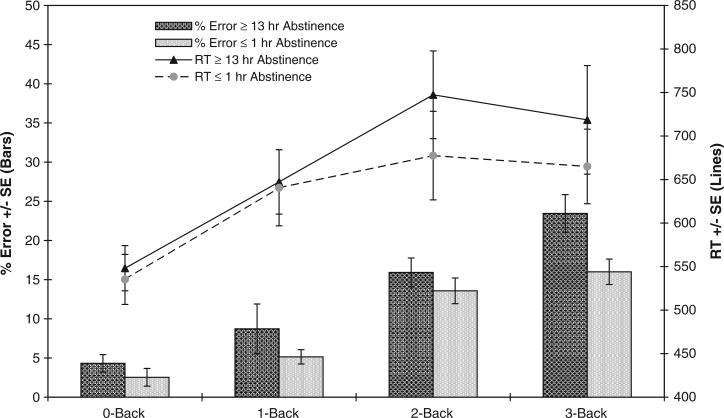
Fig. 2.
N-Back performance of smokers in abstinence and satiety sessions. Lines indicate mean RT's and bars indicate mean errors, both ± 1 SE, and both at each N-Back level. In the abstinence session, smokers responded more slowly, especially in the 2-back condition, and tended to make more errors compared with the satiety session ( p's < 0.04).

