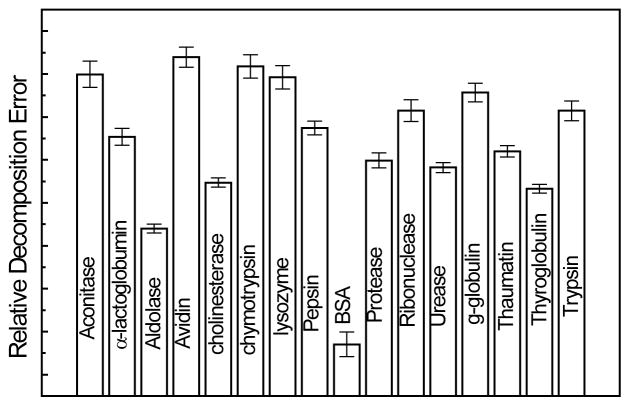
Figure 6.
Relative decomposition errors of Raman spectra of DNPH-oxiBSA into series of protein library spectrum paired with Raman spectrum of DNPH. Error bar represents one standard deviation calculated with all the Raman spectra obtained with BSA standard solutions in which the protein carbonyl level changes from 0.26 to 2.6 mol carbonyl/mol BSA. (See text for details)

