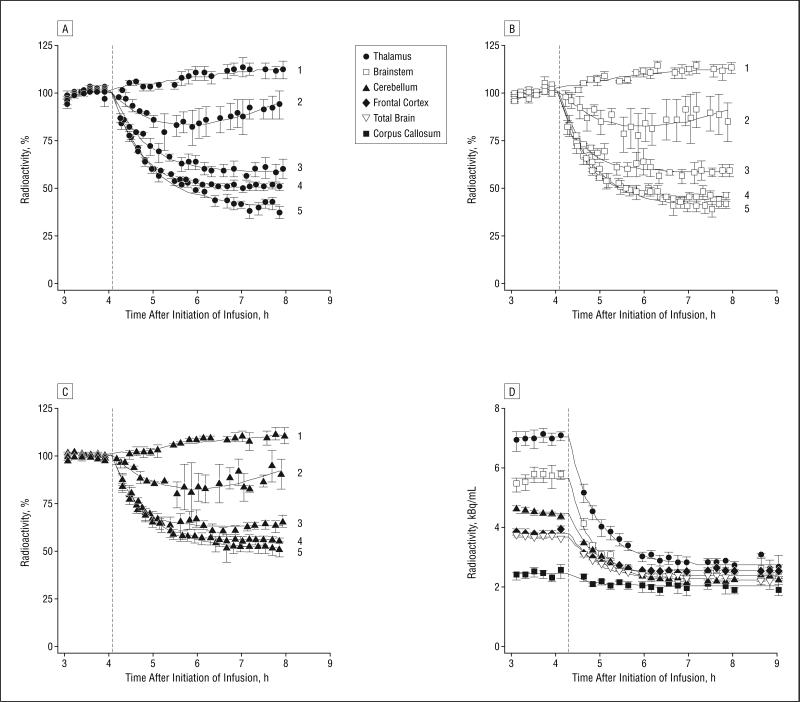
Figure 2.
Time-activity curves for the 5 smoking levels for the primary regions of interest. A, Thalamus. B, Brainstem. C, Cerebellum. Radioactivity is expressed as percentage of baseline value (mean radioactivity for the hour before the smoking break±standard errors of the mean between subjects). 1 indicates 0 cigarettes; 2 indicates 1 puff; 3 indicates 3 puffs; 4 indicates 1 full cigarette; and 5 indicates satiety (2.8 cigarettes). Dotted lines indicate the time of the smoking break. D, Displacement of radioactivity in the whole brain and regions of interest in a subject who smoked to satiety (2.5 cigarettes) during the break (mean±SE in volume of interest).

