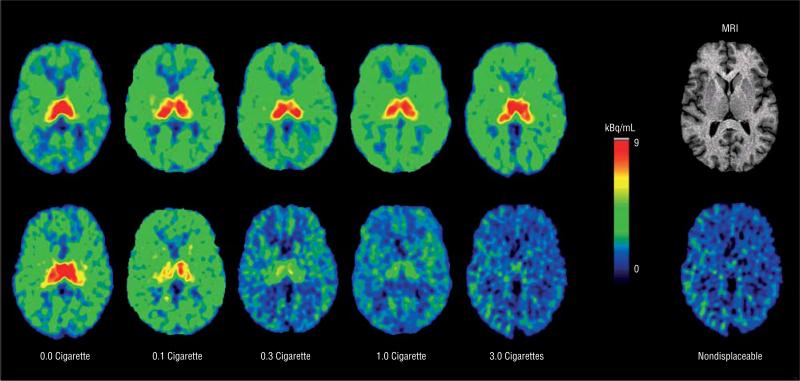
Figure 3.
2-[18F]fluoro-3-(2(S)-azetidinylmethoxy) pyridine (2-F-A-85380) positron emission tomography (PET) images before (top row) and 3.1 hours after (bottom row) cigarette smoking. Images were obtained by averaging the six 10-minute frames over the 1 hour prior to the smoking break and by averaging the seven 10-minute scans from a mean of 3.1 hours after smoking the cigarette amount listed. The far right column shows a magnetic resonance image (MRI) of the brain and a PET image of nondisplaceable radioactivity distribution (calculated). All PET images were aligned to the level shown on the MRI.

