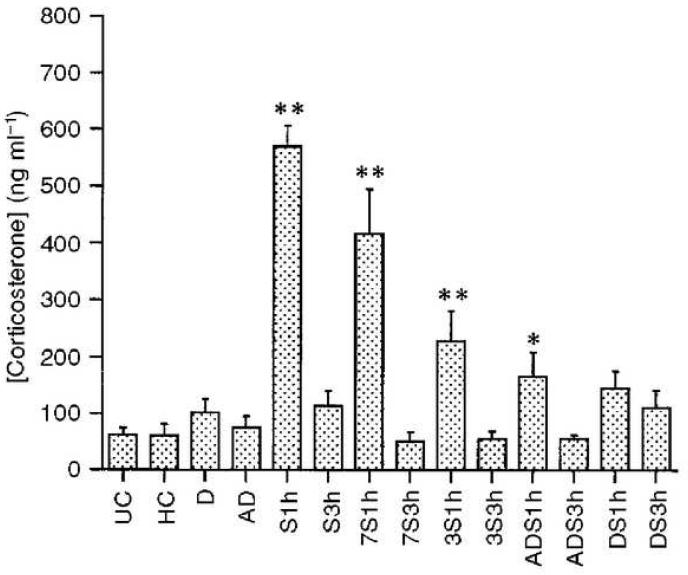
Figure 5.
HPA responses become more habituated with increasing numbers of stress exposures within a given period of time (Criterion 4). HPA responses were examined in a total of 14 groups of rats. Four groups were sampled under unstressed, basal conditions on day 15 after 14 prior days of either no treatment (UC, unhandled control), daily handling (HC), alternate day restraint (AD), or daily restraint (D). These groups, displayed on the far left, did not show any significant difference from the UC group, which was used as the primary control group. The remaining ten groups were restrained on day 15 or 16 and sampled either at the end of 1 hour restraint (1h groups) or 2 hours after the end of one hour restraint (3h groups) at which time responses for all groups had all returned to baseline (as indicated by no significant differences seen between any 3h group and UC). The largest significant elevations in corticosterone concentrations over UC animals were seen in naïve animals acutely restrained on day 15 (S1h). The next largest elevations were seen in animals exposed to restraint once every 7 days prior to restraint on day 15 (7S1h). The next largest elevations were seen in animals restrained once every three days prior to restraint on day 16 (3S1h). A slight, but significant elevation in corticosterone concentrations was seen in animals restrained every other day prior to restraint on day 15 (ADS1h) and no significant elevation in corticosterone over baseline was seen in animals restrained daily (DS1h). Thus, the most frequent presentation of restraint, daily restraint, produced the strongest habituation and habituation was weakened with less frequent stress exposure. This pattern of results supports Criterion 4, which states that habituation should be enhanced by stimulating more rapidly over a given period of time. ** p ≤ 0.01, as compared to UC; * p ≤ 0.05 as compared to UC. Data are expressed as mean + SEM. From Ma and Lightman, 1998, with permission.

