
Figure 3.
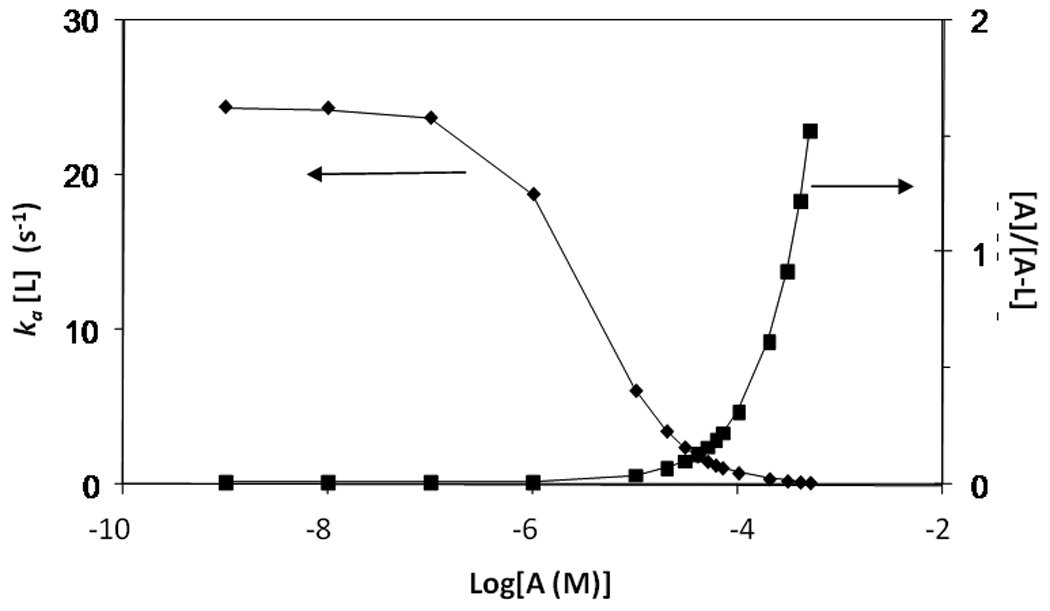
Theoretical plots showing the values expected for ka [L] (◆) and [A]/[A−L] (■) as a function of log[A] if a local equilibrium is established between a warfarin sample and immobilized HSA column. These results were calculated using Eqs. (8) and (9) along with an average association equilibrium constant for racemic warfarin with HSA of 3.0 × 10⁵ M−1 at 25°C, an association rate constant of 1.0 × 10⁵ M−1 s−1 and a total effective concentration of 172 µM for warfarin binding sites in the HSA column.