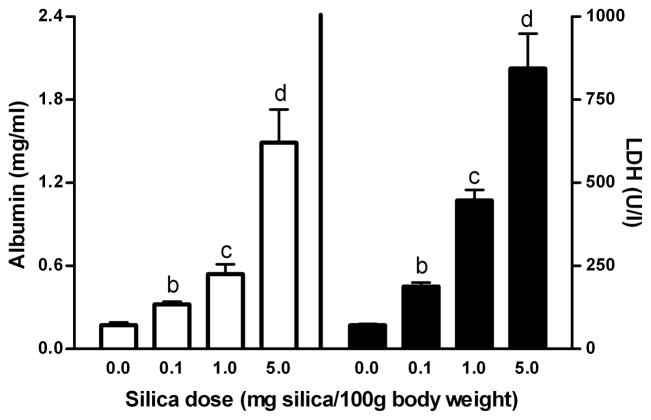
Figure 1. Albumin concentration and LDH activity in BAL fluid of rat lungs as a function of silica dose.
Scales on y-axes have been set to allow direct comparison of the magnitude of relative increases in albumin concentration (panel A) and LDH activities (panel B) with increasing silica dose. Within each panel, values (means ± SE; n = 6–7) identified by different lower case letters are significantly different (p<0.05)

