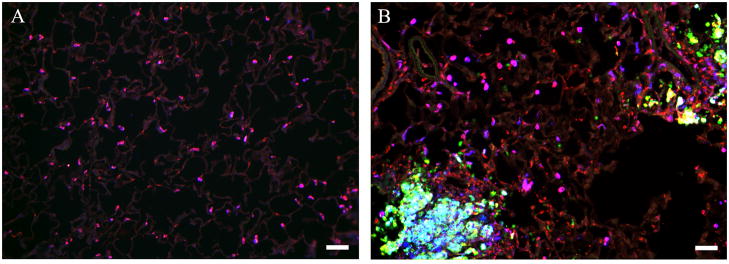
Figure 5. Immunohistochemical comparison of control and silica-treated rat lungs.
Immunohistochemistry was performed as described in Materials and Methods. Results are shown for rats treated with (A) vehicle or (B) 5 mg silica/100 g BW. Key to antibody staining: arginase I (blue), iNOS (green) and the macrophage marker ED-1 (red). Arginase I-positive macrophages are pink; iNOS-positive macrophages are yellow; cells expressing both arginase I and iNOS are turquoise. See Figure 6 for more detailed analysis. Photomicrographs are representative of multiple sections examined for each of 8 rats in both treatment groups. Scale bar = 50 μm.

