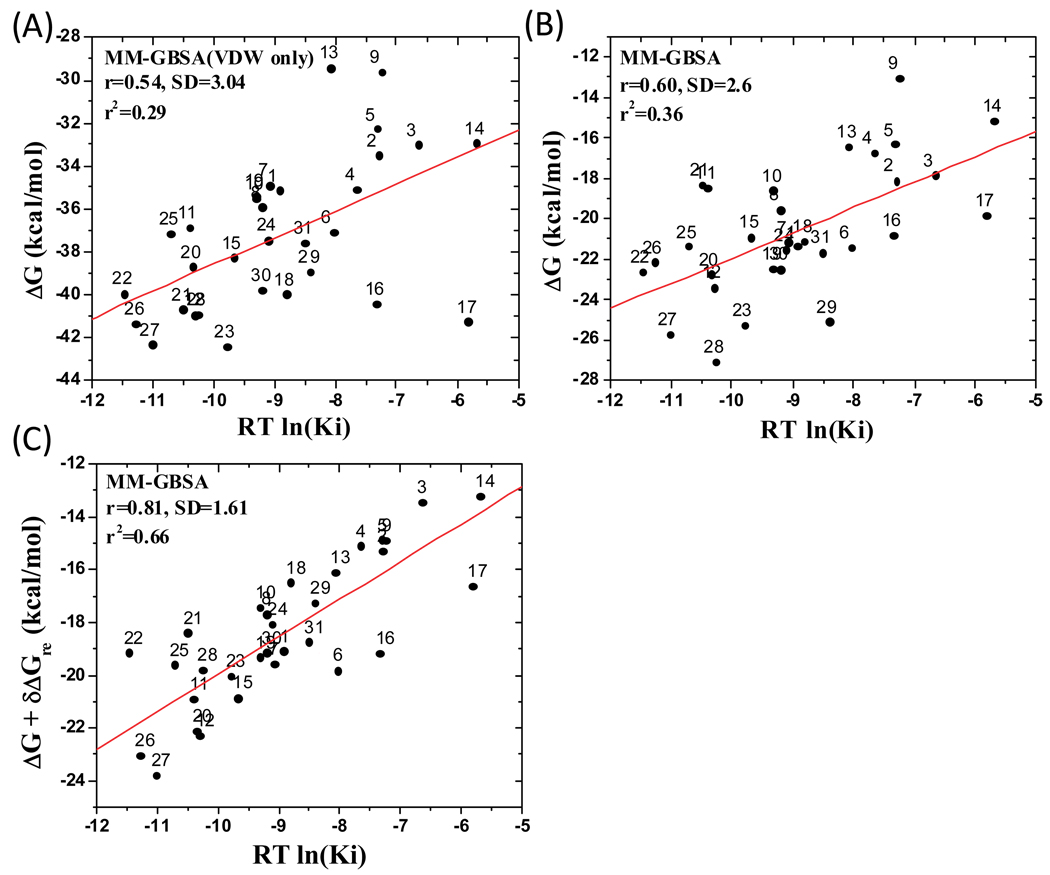
Figure 6.
Correlation for 31 compounds between the experimental Ki values and (A) van der Waals interaction, (B) binding free energy, (C) binding free energy with ligand reorganization free energy upon binding based on the MM-GBSA method. Here, ΔG is the calculated binding free energy based on the protein-ligand complex conformations.

