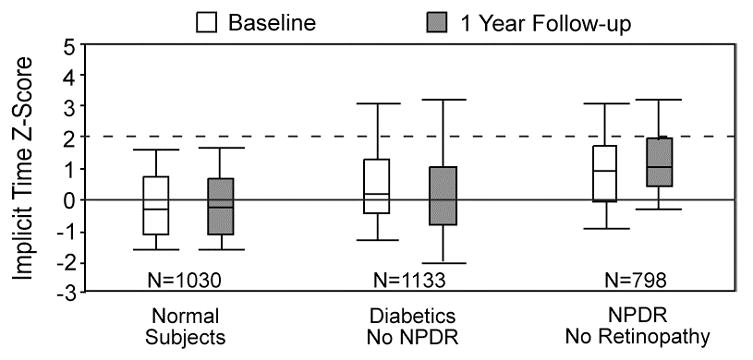
Figure 3.

Local mfERG implicit time Z-score distributions at baseline and one-year follow-up. Results are shown for normal subjects, subjects with diabetes and no retinopathy (“Diabetics No NPDR”), and from retinopathy-free areas in the eyes of diabetic subjects with some NPDR (“NPDR No Retinopathy”). The line at Z-score = 0 indicates the mean normal value and the dashed line indicates the limit of normal. The distribution of implicit times of diabetic subjects without retinopathy is centered between those of the normal and NPDR groups, and did not change significantly over the one-year period. (Adapted from Han, et al., 2004c.)
