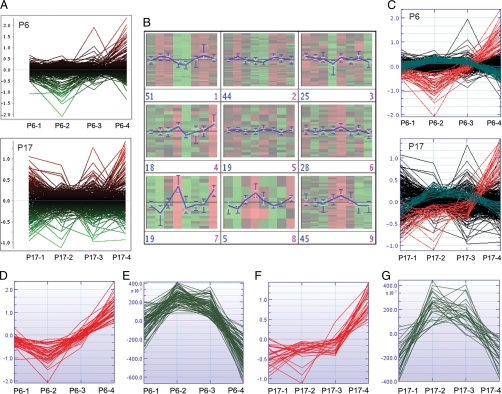
Fig. 4.
Unsupervised analysis of trend data sets. A, proteins identified in tumor xenografts over four consecutive generations are plotted for P6 and P17. B, using self-organizing maps and profile searching, two consistent dominant profiles of protein expression were found in both patients (C). Profile I (D and F) shows proteins up-regulated in late/angiogenic tumors versus early/invasive tumors. These proteins are mainly of tumor/human origin. Profile II (E and G) shows the up-regulation of proteins in the two intermediary tumor generations. Proteins in this profile are mainly of host/rat origin. Note that not all proteins in the profiles are identical between P6 and P17. The y axis represents protein quantity value (log2 intensity). P6-1, -2, -3, and -4 indicate the respective tumor generation derived from P6; idem for P17.

