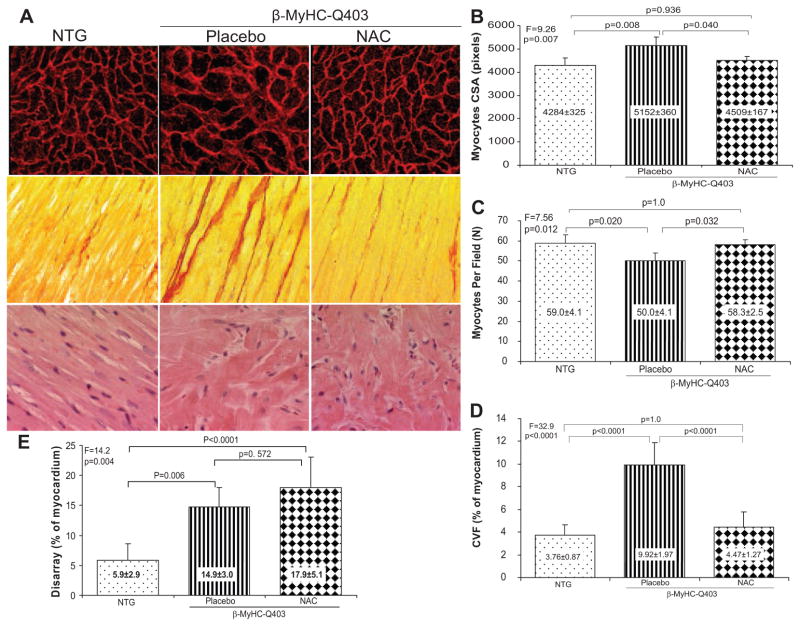
Figure 2.
Histological phenotype of myocyte hypertrophy (top panels), interstitial fibrosis (middle panels), and myocyte disarray (bottom panels). Representative high-magnification (×400) fields are shown (A). B through E show quantitative values of myocyte cross-sectional area (CSA), number of myocytes per each high-magnification (×400) microscopic field, CVF (% of myocardium), and extent of myocyte disarray (% of myocardium), respectively. NTG indicates nontransgenic.

