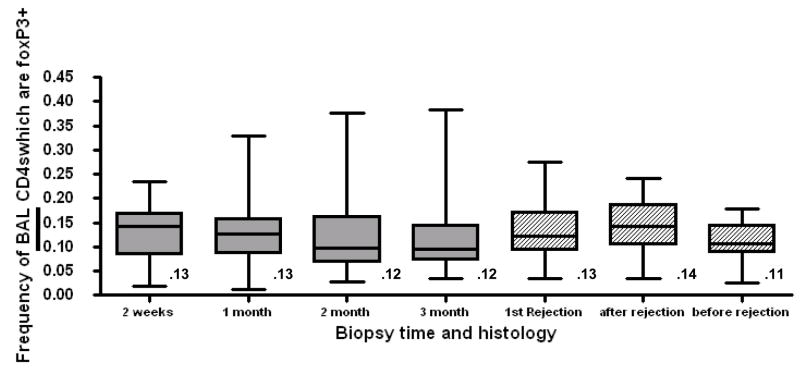
Fig 3. Tregs are consistently present in BAL but do not vary significantly with the time post transplant.
Grey boxes show the frequency of BAL Tregs from the first 4 sequential biospies performed at 2 weeks, 1 month, 2 month, and 3month post transplant. Numbers below the box represent the mean Treg frequency. The solid line within the box represents the median frequency. The number above each box indicates mean frequency. P=ns between all time points by 2-tailed t-test. Hatched boxes show Treg frequency in the clinical conditions of the first episode of rejection, the follow-up after rejection and before rejection. P=.0016 between before and after rejection by 2-tailed t-test.

