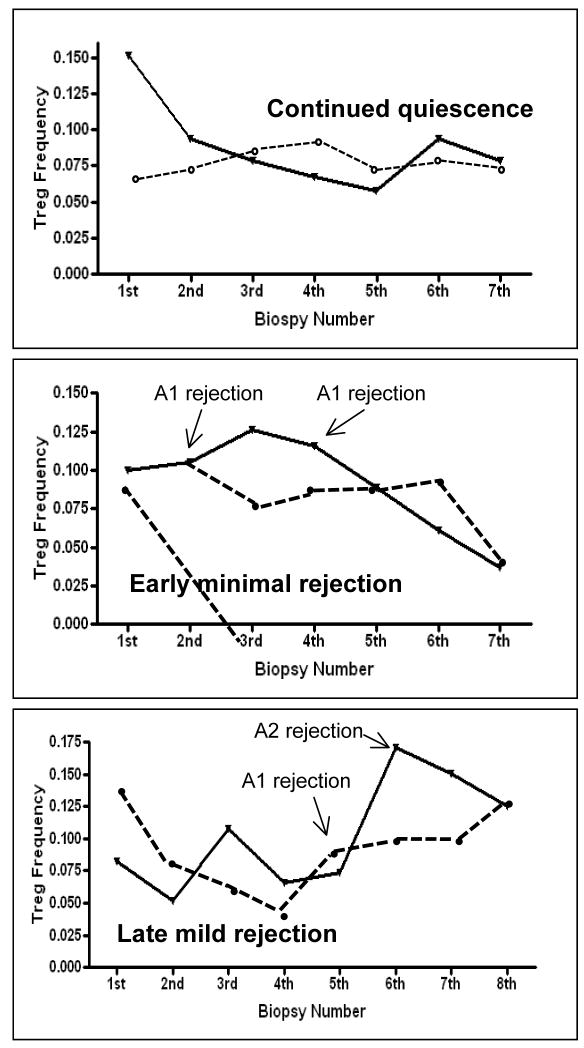
Fig 6. Longitudinal patterns of BAL and pbmc Tregs in individual patients.
Solid line Indicate BAL Treg frequency and dassed line indicates pbmc Treg frequency. Top panel Shows pattern in individual with no rejection in the first post transplant year. Middle panel Shows pattern in a patient with 2 episodes of early minimal rejection, followed by a Period of prolong quiescence. Bottom panel shows pattern in patient with back-to-back Rejection starting at 6 months post transplant.

