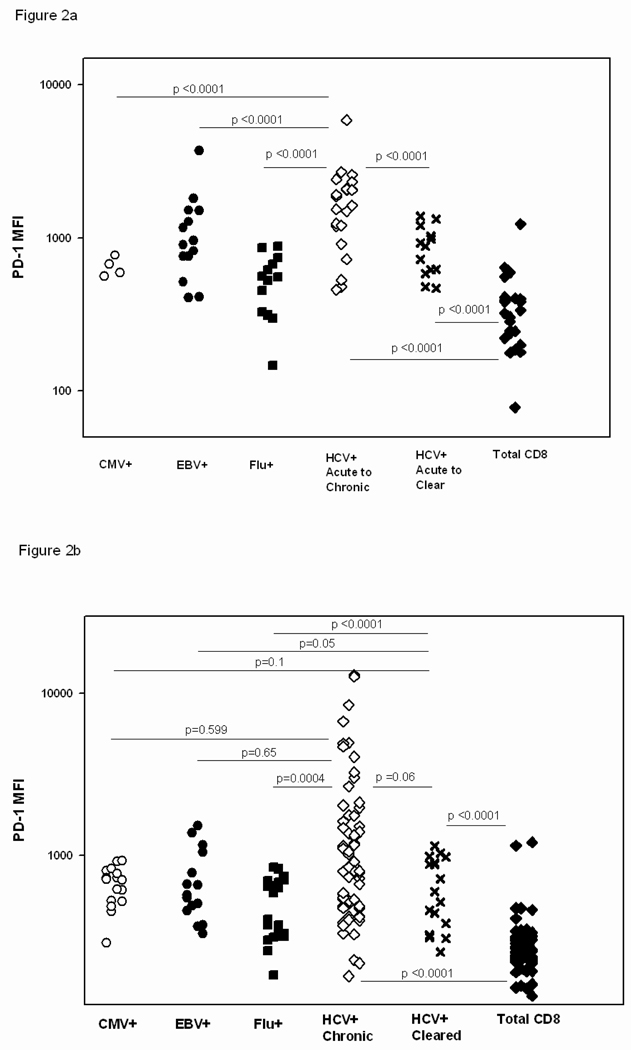
Figure 2. PD-1 expression on HCV-specific T cells is higher than on influenza-specific T cells and the general CD8 T cell population regardless of outcome of infection or the phase of infection.
The MFI of PD-1 on the T cell surface was compared between HCV specific T cells from subjects with either outcome of infection, control specific T cells and the general CD8 population in the first 180 days of HCV infection (HCV+ acute to chronic or cleared, 2a) and at time points following 180 days of HCV infection (HCV+ chronic or cleared, 2b). The level of PD-1 expression is also higher in acute infection on HCV specific T cells from subjects who remain persistently infected than those who clear HCV infection. Each data point represents the MFI of the PD-1 level on a specific tetramer positive population within an individual.

