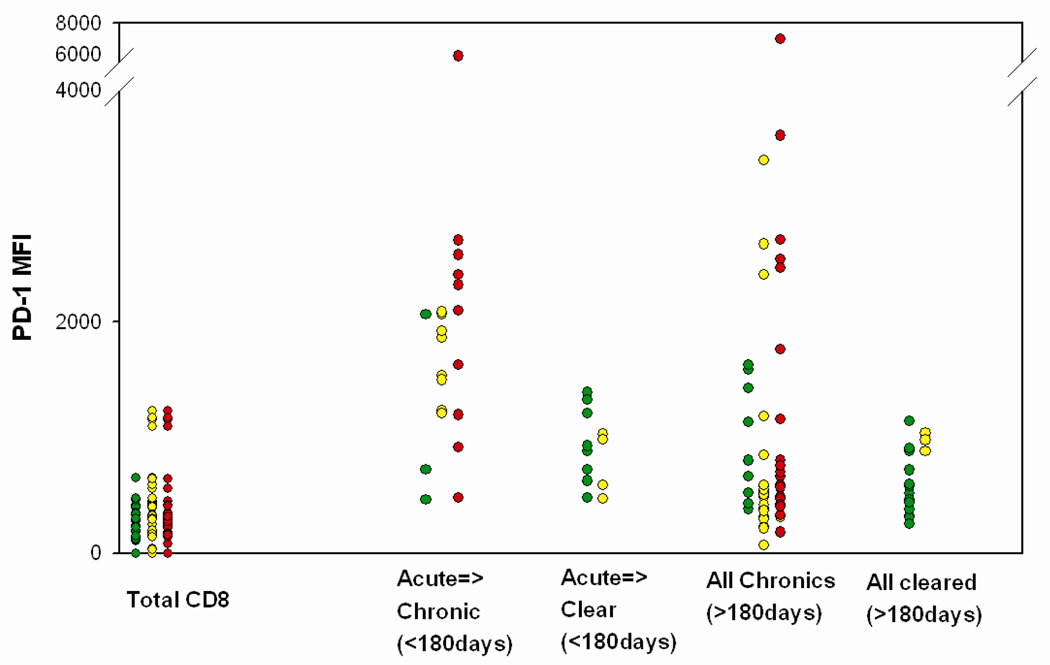
Figure 3. PD-1 expression on HCV specific T cells stratified by HCV RNA level during early and late infection.
HCV RNA levels at the time the T cells were acquired are indicated by colored symbols. Red: >100,000 copies/mL Yellow: 600–100,000 copies/mL Green: <600 copies/mL. Acute infection was defined as time points less than 180 days from initial viremia. PD-1 levels are highly variable in chronic infection. Some HCV-specific T cells from subjects with chronic infection expressed low PD-1 levels in the setting of high circulating HCV RNA levels (Red dots at low PD-1 MFI values).

